Ahorra un 25 % (o incluso más) en tus costes de Kafka | Acepta el reto del ahorro con Kafka de Confluent
How to Visualize Your Apache Kafka Data the Easy Way with Stream Lineage
Understanding how data flows and is transformed across the different layers of an organization’s application and data stack is one of the most challenging governance problems companies are facing today. Who is producing data? Who is consuming data? How has that data been transformed in between? These are all simple questions with very difficult answers. Data is the lifeblood of the modern business, flowing to and from every corner of an organization, but without proper controls and visibility, it might end in undesirable, dangerous places and give rise to data obscurity or distrust.
Apache Kafka®’s core strength is to serve as the central nervous system for real-time data: connecting, storing, and analyzing continuous streams of data that represent all the critical events across a business in real-time. The range of real-time experiences that this new paradigm unlocks is revolutionizing entire industries, powering use cases such as real-time inventory management, customer 360, fraud detection, and streaming ETL pipelines.
With Kafka at its core, Confluent is in a prime position to empower teams to observe and track critical data flows across their organization immediately as they occur.
Stream Lineage: The map of all your data in motion
Stream Lineage is a tool Confluent built to address the lack of data visibility in Kafka and event-driven architectures. Confluent’s Stream Lineage provides an interactive map of all your data flows that enable users to:
- Understand what data flows are running both now or at any point in the past
- Trace where each data flow originated from
- Track how data is transformed along its journey
- Observe where each data flow ends up
In summary, Stream Lineage helps you visualize and shine the light across all your data streams flowing through Kafka.

Gif source: Tenor
Within this map of data in motion, you can see everything that is producing and consuming data to and from Kafka topics, including:
- Connectors that bring data into (source connectors) or push data out (sink connectors) from Kafka topics
- Kafka Client applications that produce and consume data to and from Kafka topics
- Kafka Streams applications that perform stream processing on Kafka topics
- ksqlDB streams and tables that perform stream processing on Kafka topics
- Confluent CLI scripts that produce and consume data to and from Kafka topics
Note that this map is built automatically out-of-the-box in Confluent Cloud without any additional instrumentation. It is powered purely by the activity of producers and consumers of data in Kafka.
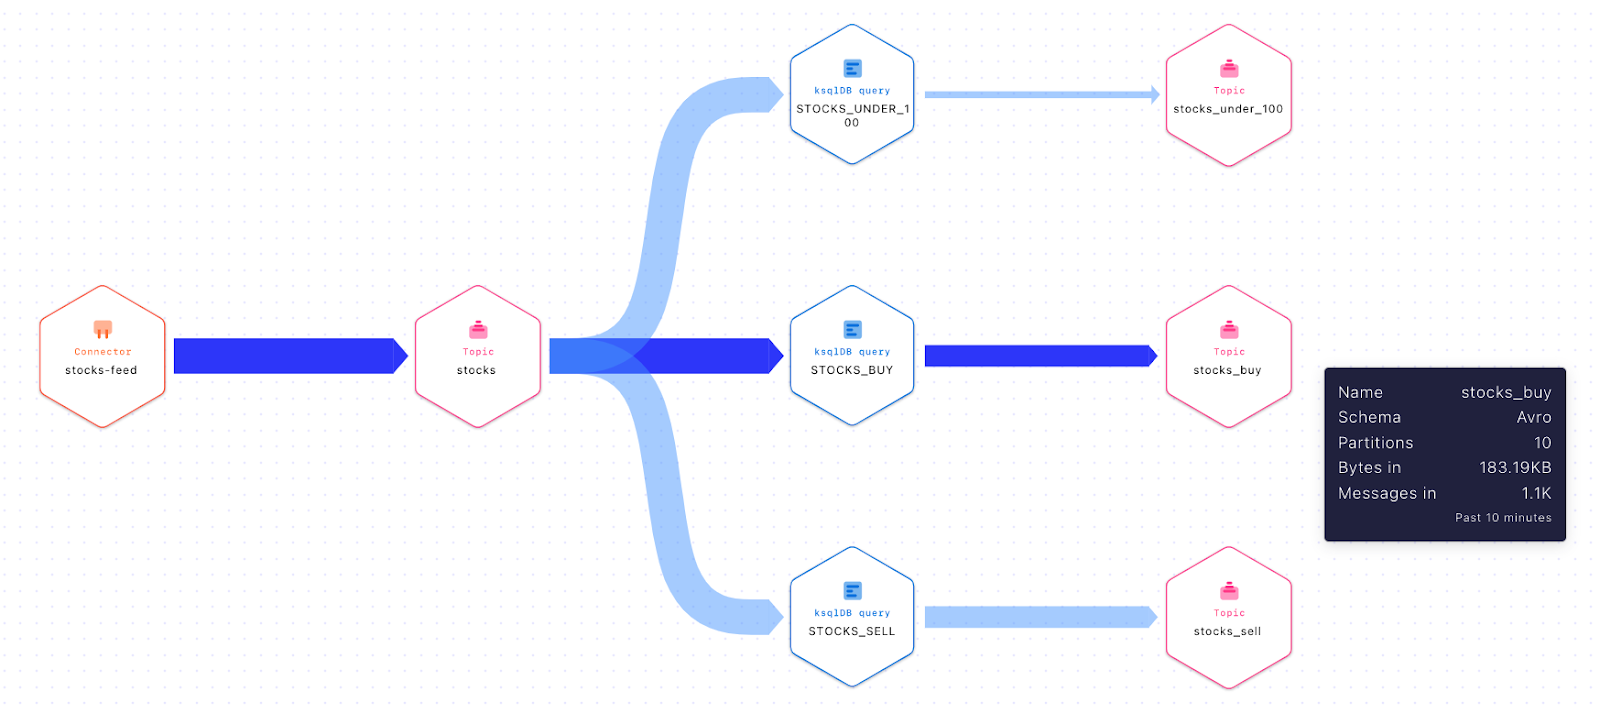
Stream Lineage for a data flow representing stock-related events
Once inside Stream Lineage, users can navigate the flow of data and stop anywhere along the way to inspect and learn more about a particular producer, consumer, or topic.
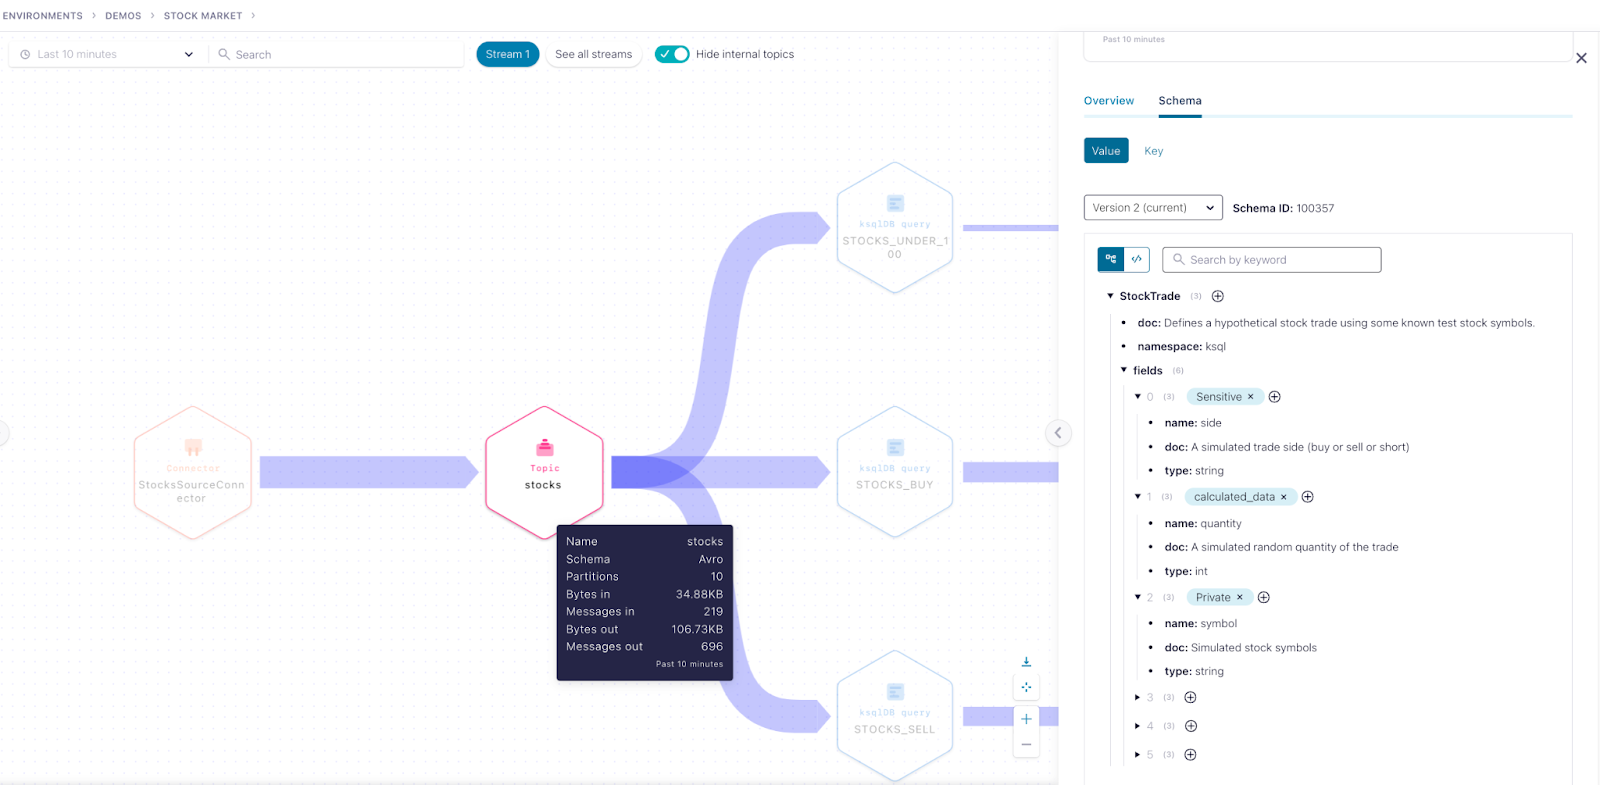
Inspect a Kafka topic
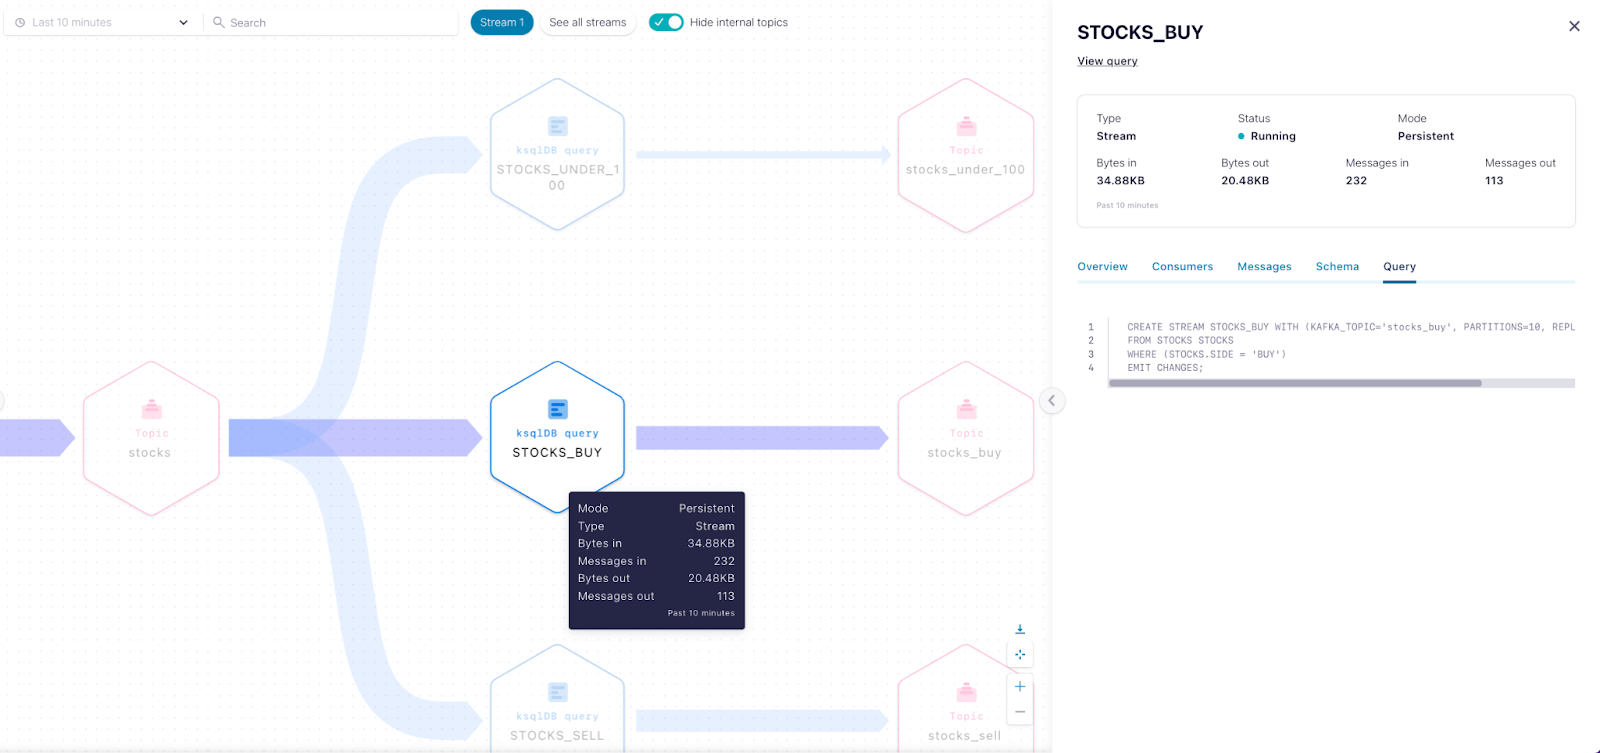
Inspect a ksqlDB query
By default, Stream Lineage shows data flows based on the last 10 minutes of activity, but users can increase the time window up to the last 24 hours. As an added bonus, users can also set a custom date and one-hour time window going back seven days.
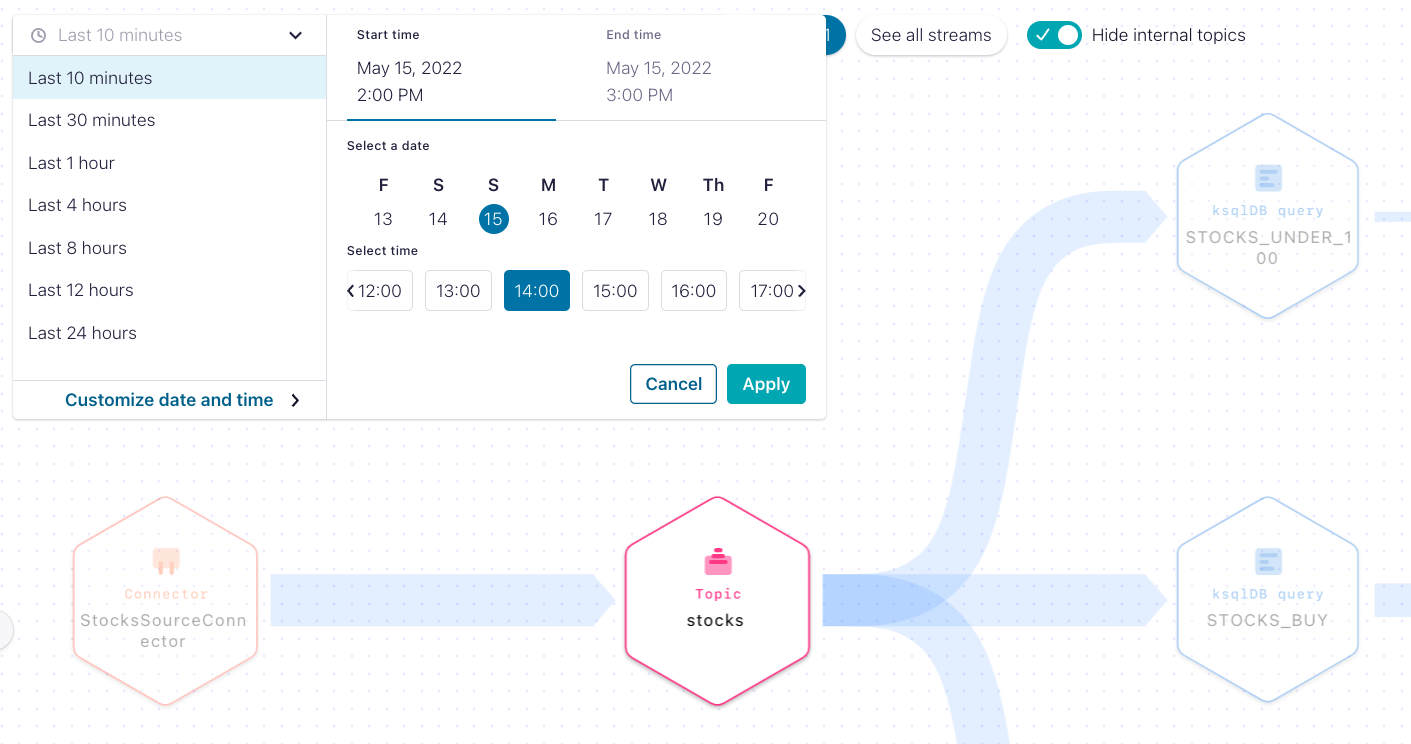
Set a custom date window to display the data flow
In very complex topologies you might want to quickly discover and troubleshoot a particular application, which can be difficult with thousands of producers and consumers. With lineage search, you simply type the name of the Kafka client ID to see if the corresponding application is alive and where it is located on the data flow. Plus, you can also search for topics, connectors, ksqlDB queries, and consumer group IDs within the context of the data flow you are looking at.
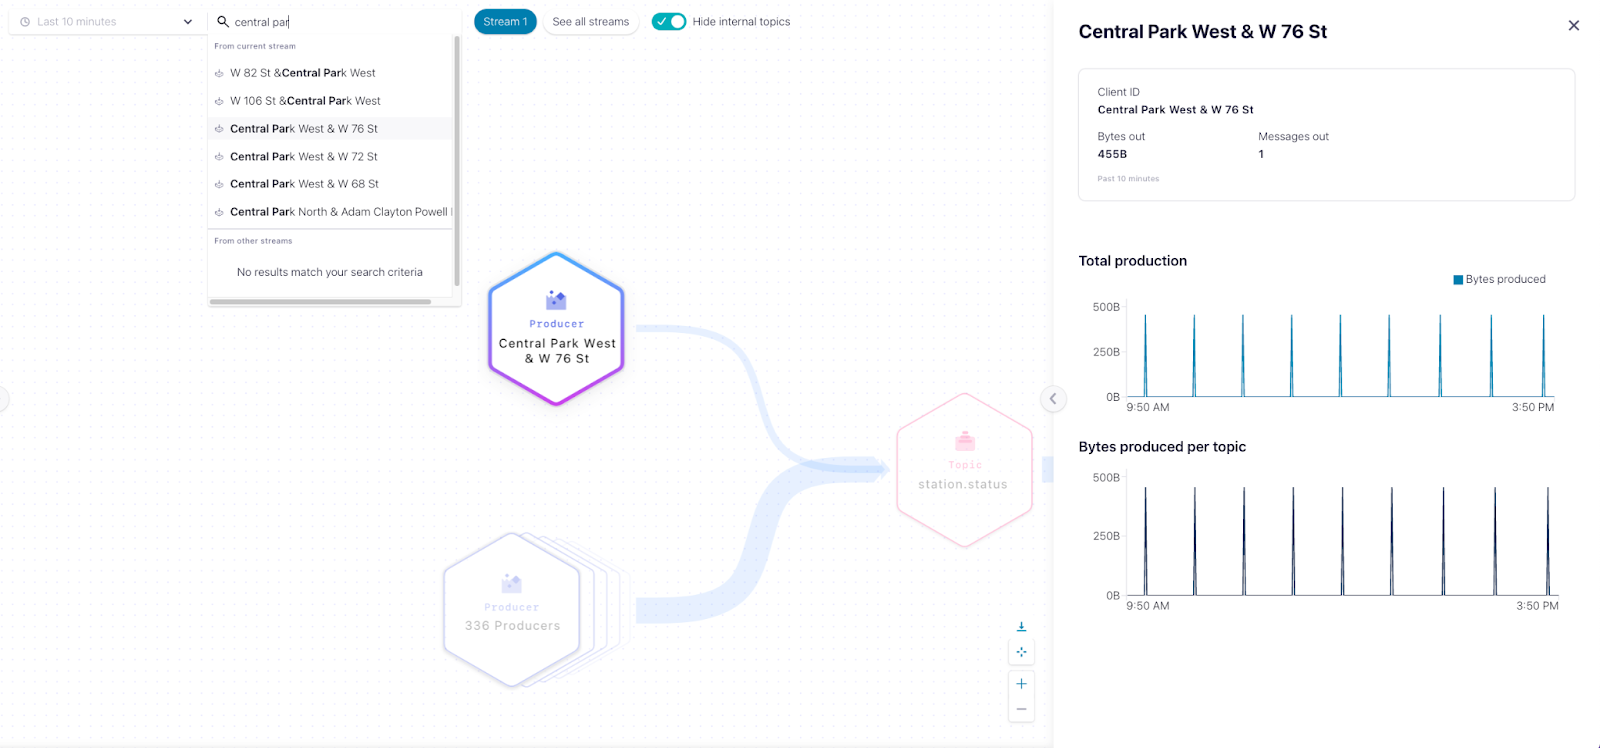
Search on Stream Lineage
Top 3 use cases powered by Stream Lineage
1. Development: Building data pipelines
Stream Lineage enables developers to stitch together the different building blocks of a data pipeline and immediately visualize if they are connected correctly and moving data as expected.
Example scenario: Alvin, a data engineer, is tasked with building a data pipeline that sources data from their CRM and multiple customer touchpoints, joins these two streams with ksqlDB, and finally sinks the data to the data warehouse for analytics.
Step 1: Setup the CRM source connector to move customer data into the customer.info topic.

Step 2: Write a Kafka producer for each customer channel touchpoint to publish customer interactions to the topic customer.touchpoints.
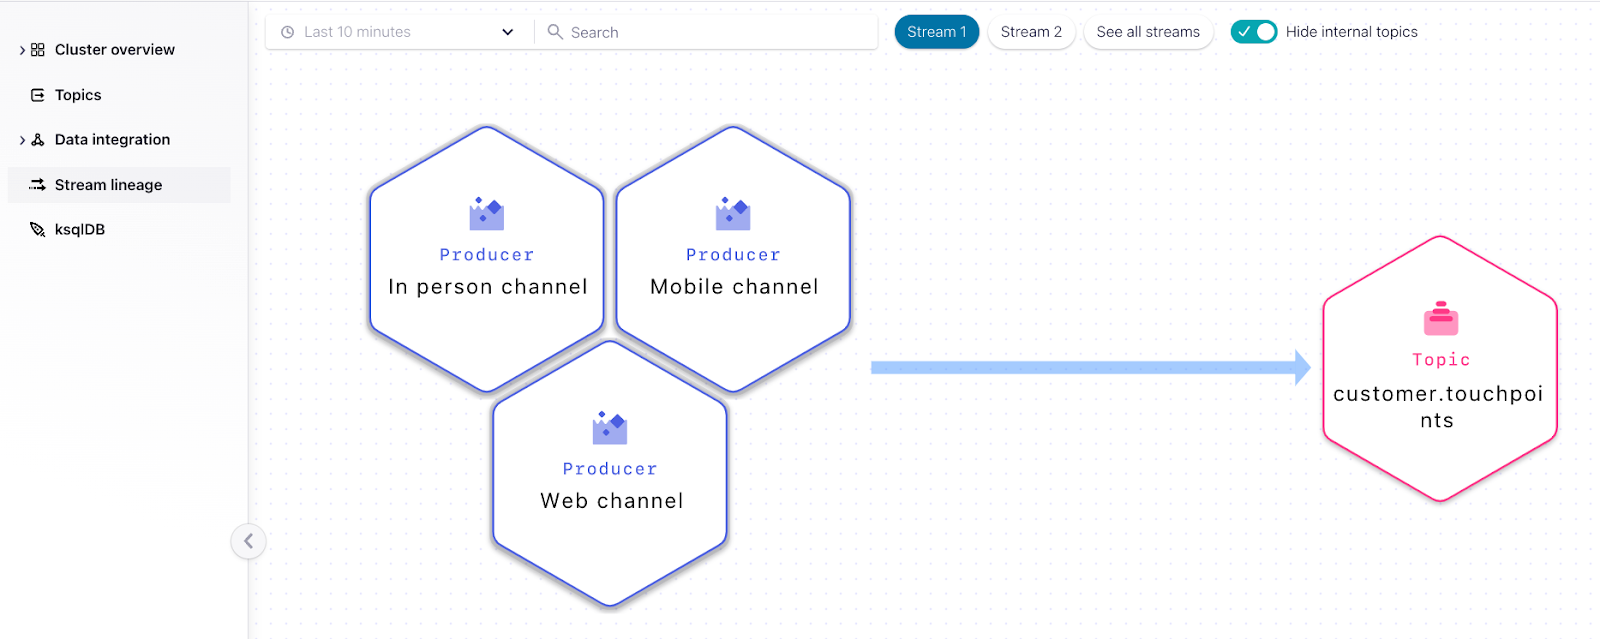
Note that we now have two streams with their corresponding topics, customer.info and customer.touchpoints.
Step 3: With ksqlDB, create a new stream on topic customer360 that joins customer data and touchpoints data from the customer.info and customer.touchpoints topics respectively.
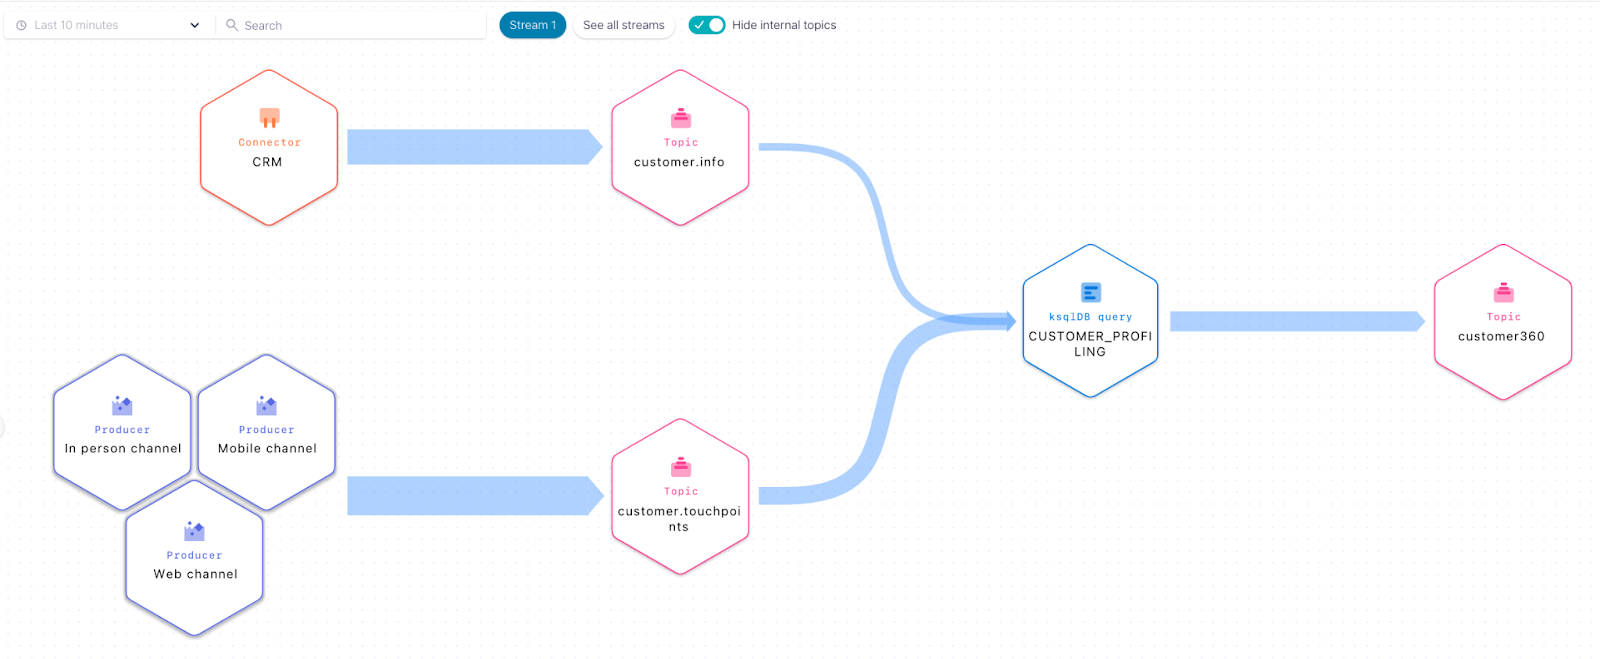
Step 4: Setup the data warehouse sink connector to sink customer profile data from the customer360 topic.
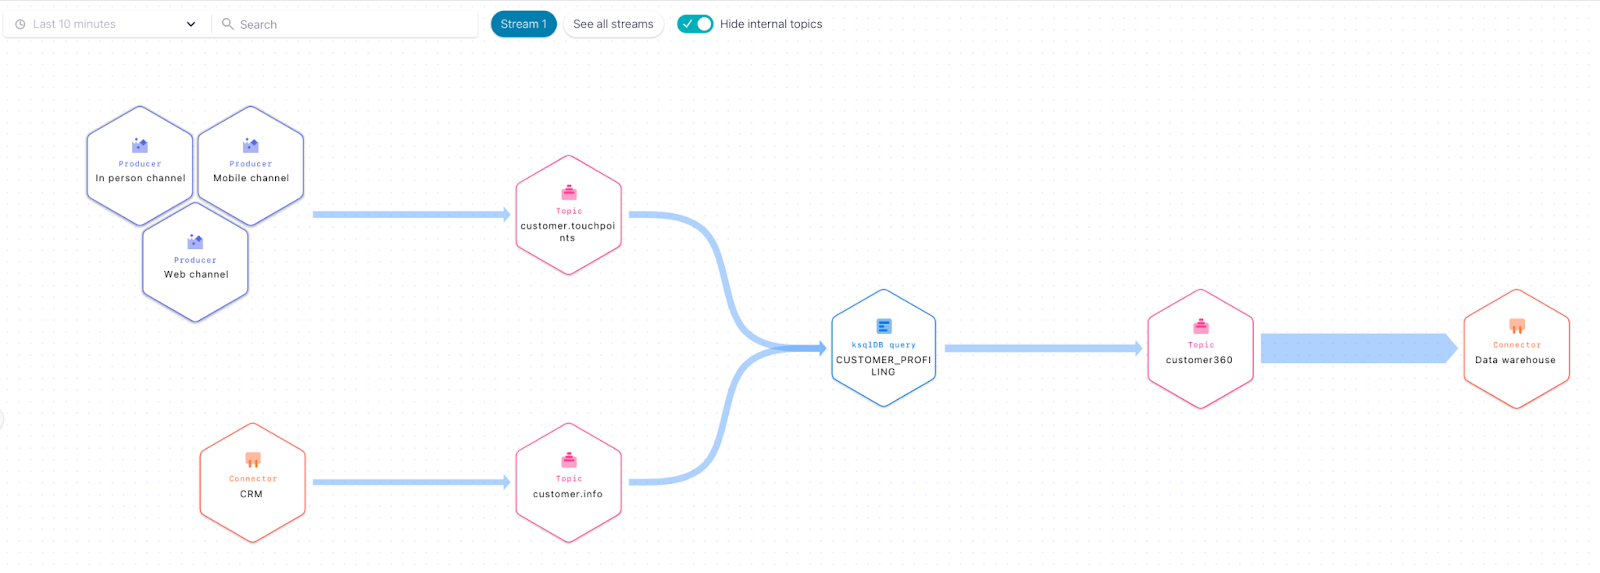
And there we have it: with Stream Lineage, Alvin has just built a customer data pipeline with multiple sources, allowing him to run a variety of customer analytics. Even better, he is able to visualize the entire data flow in real time while doing so!
2. Monitoring: Troubleshooting data pipelines
Stream Lineage allows operators to have both a bird’s eye and detailed view of all the data pipelines running on a cluster so they can quickly pinpoint issues and fast track incident resolutions.
Example scenario: Liz, a DevOps engineer, is notified that all analytic reports that support multiple teams across the organization stopped working around noon. Analytics reports are powered by the customer360 data stream Alvin built above.
Step 1: Search for customer360 in the global search and go to the topic.


Step 2: Click See in Stream lineage to visualize all the producers and consumers of the topic.
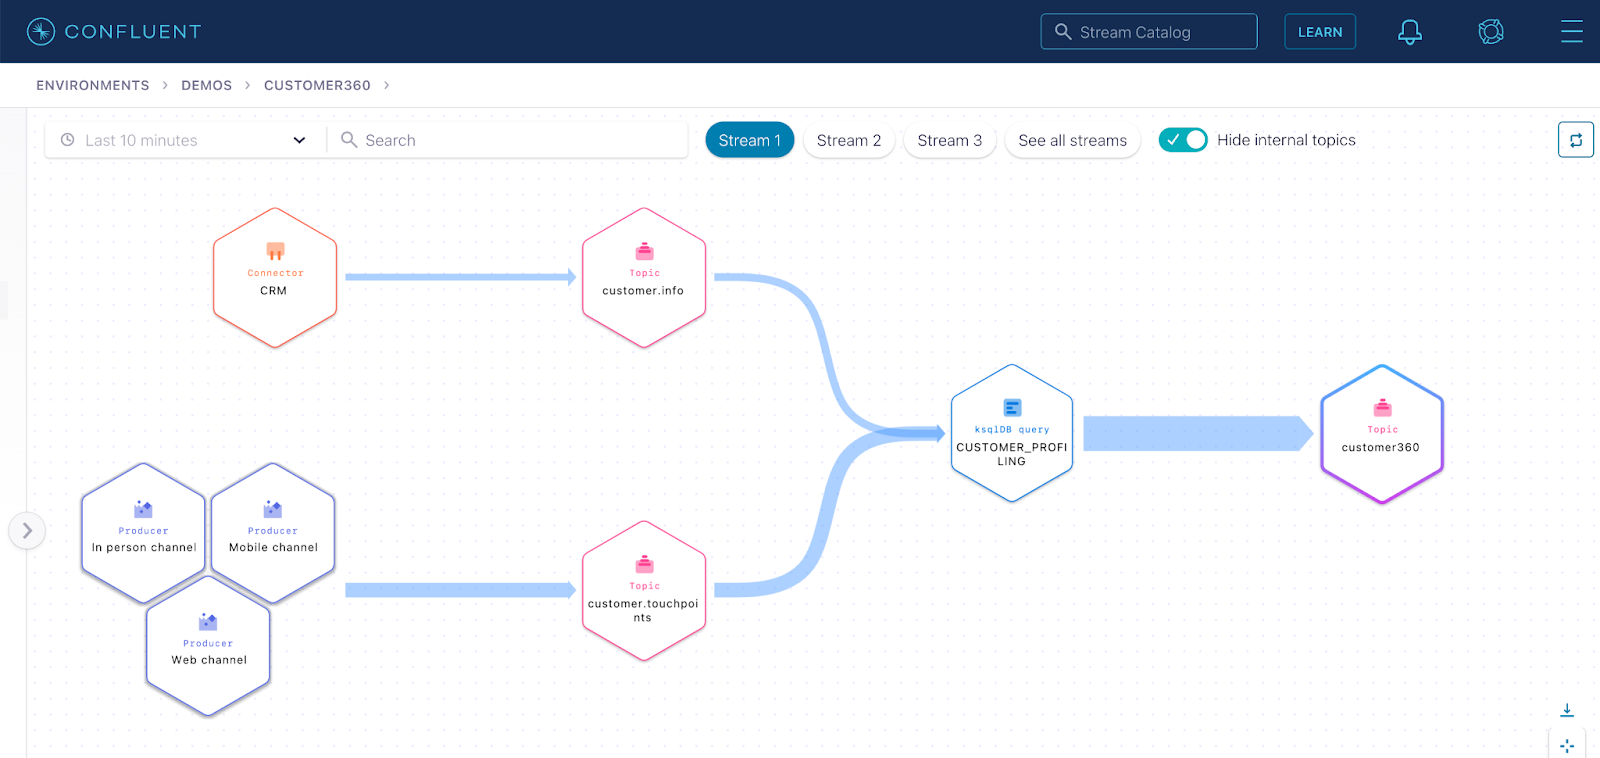
Notice that the customer360 data that powers the analytic reports is not being pushed out to the data warehouse via the corresponding sink connector.
Step 3: Change the lineage timeframe to 11:00 a.m.–12:00 p.m., immediately before the incident was reported.
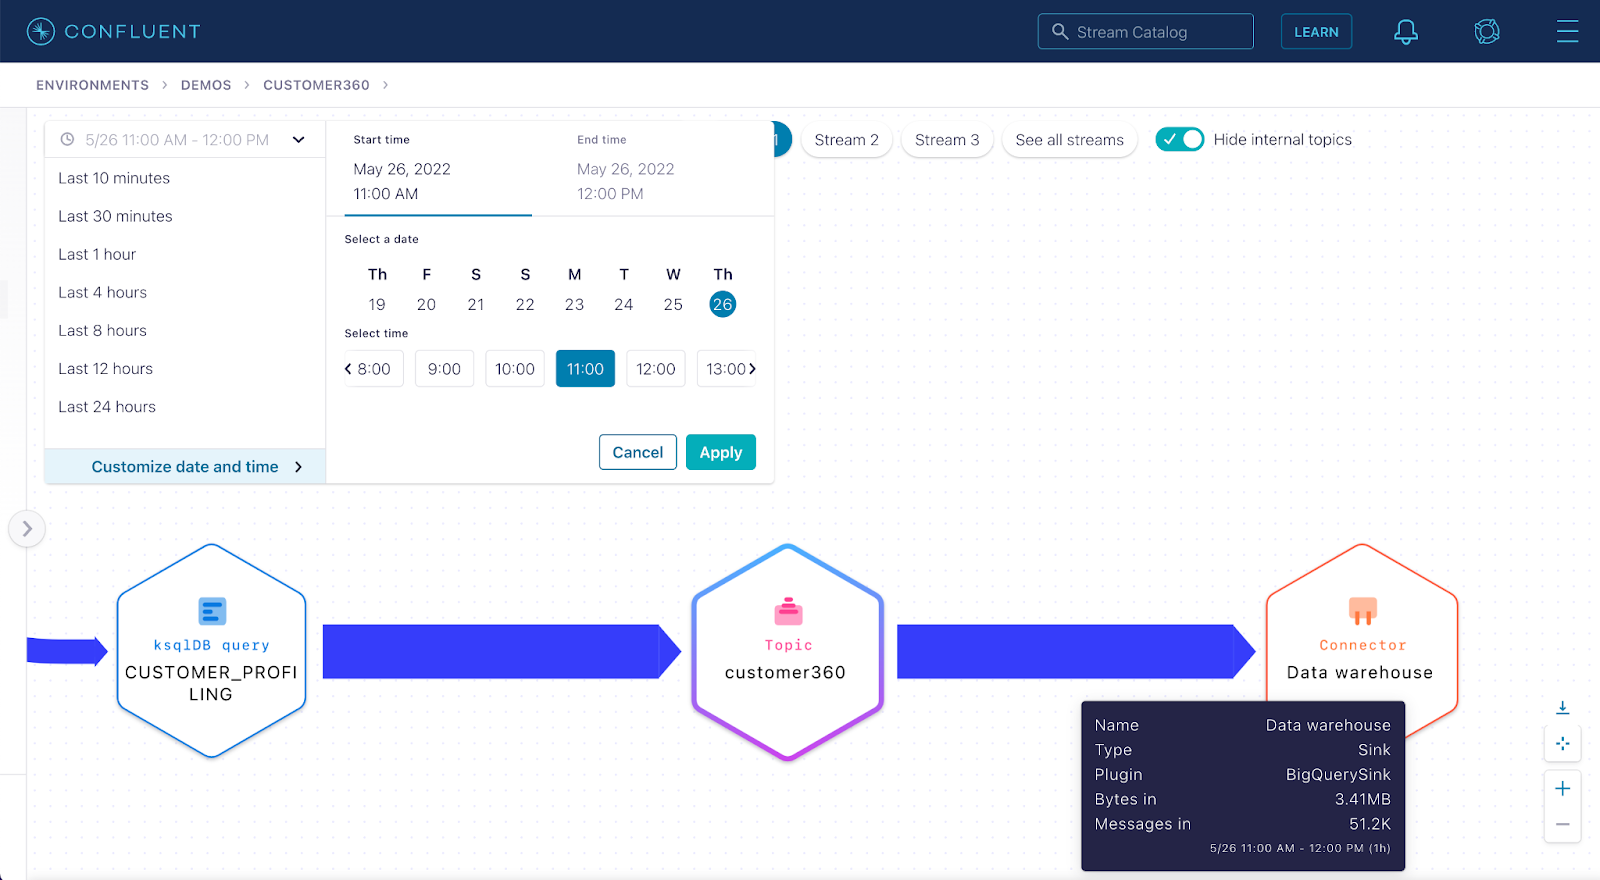
Notice at that time, the data warehouse connector was consuming data from the customer360 topic and pushing it out to BigQuery, which is used for the company’s analytics.
Step 4: Jump to the “Data warehouse” connector page to investigate more.

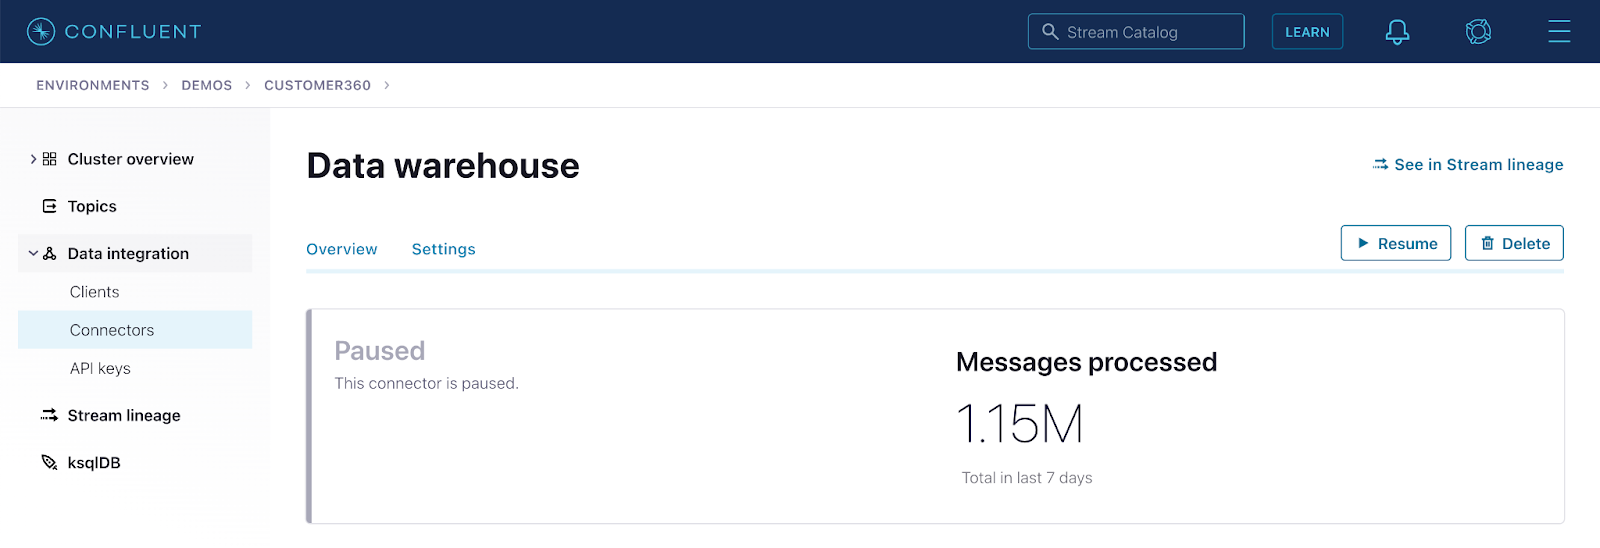
Notice the connector is paused, which is the source of the problem. Click resume and restore the analytic reports that multiple teams across the company depend on to run the business. Congratulations Liz, you just saved the day!
Compliance: Tracking data processing flows
Stream Lineage provides an always up-to-date view of applications and services processing streaming data. This type of data processing artifact can then be used to support audits and compliance questionnaires.
Example scenario: Helen, a data compliance manager, gets a visit from a GDPR auditor who wants to drill into the data processing flows of customer PII streaming data across the company.
Step 1: Search for PII on the global search.

Step 2: Navigate the search results to get to the topic that has a schema with fields tagged as PII.
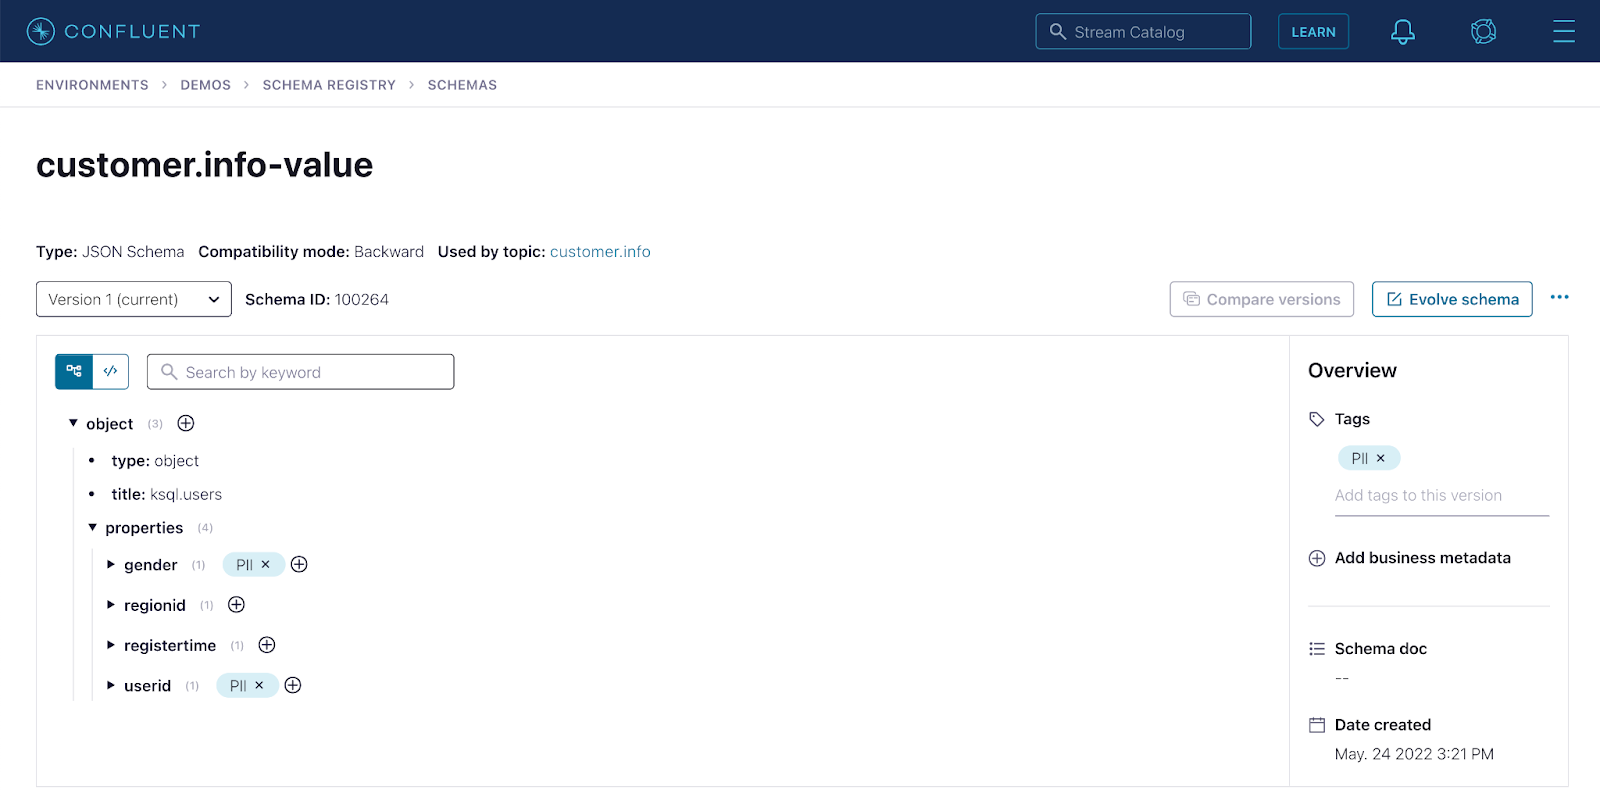

Step 3: Enter the lineage of the topic to visualize all the producers and consumers that interact with the PII data.
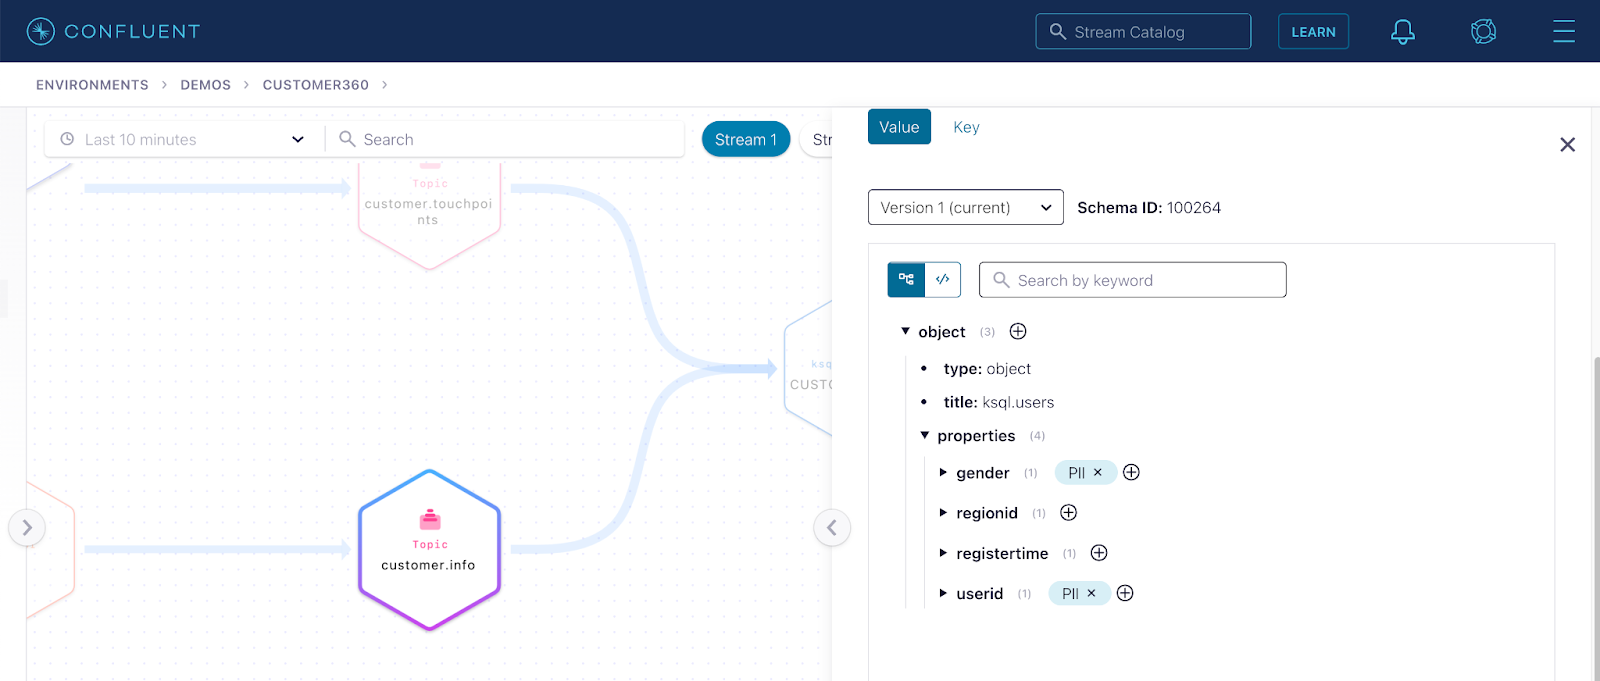
Step 4: Click Export to get the lineage artifact you need to show the auditor.
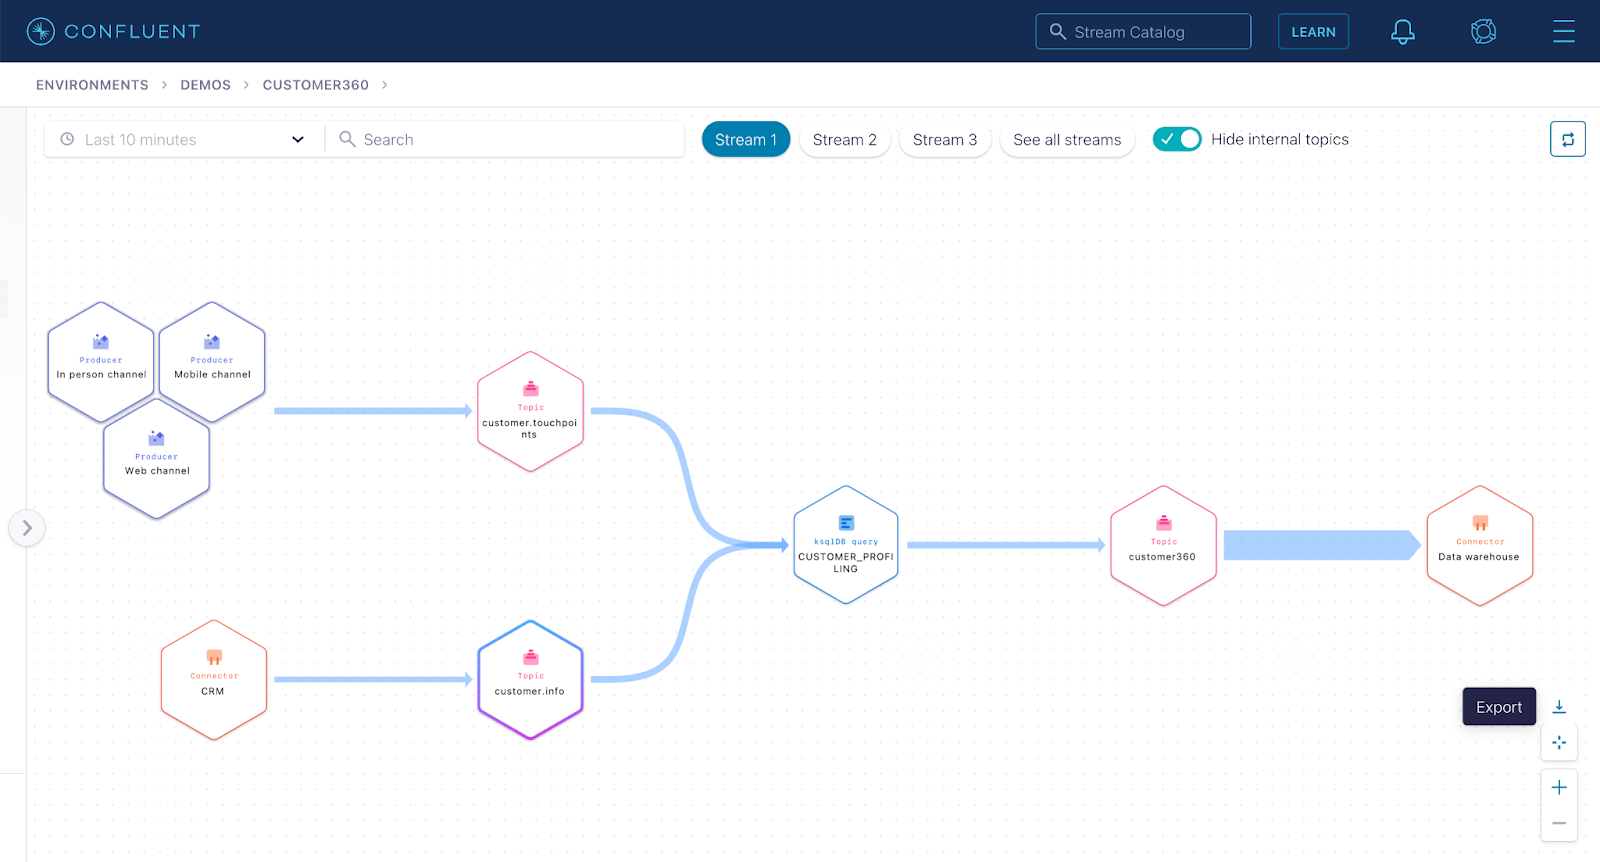
Helen’s job was made easy with just a few clicks—no auditor and compliance headaches for her with the help of Stream Lineage!
Get started today
With Stream Lineage, organizations can access an interactive, graphical UI of their data relationships in real time, with both a bird’s eye view and drill-down magnification. This full visibility lets you know what is happening with your data at any time: where your data is coming from or going, and how it was transformed upstream at a given time.
If you are not already using our Stream Lineage features (or other Stream Governance tools), you can get started by signing up for a free trial of Confluent Cloud. For new customers, use the promo code CL60BLOG for an additional $60 of free Confluent Cloud usage.*
¿Te ha gustado esta publicación? Compártela ahora
Suscríbete al blog de Confluent
Empowering Customers: The Role of Confluent’s Trust Center
Learn how the Confluent Trust Center helps security and compliance teams accelerate due diligence, simplify audits, and gain confidence through transparency.
Unified Stream Manager: Manage and Monitor Apache Kafka® Across Environments
Unified Stream Manager is now GA! Bridge the gap between Confluent Platform and Confluent Cloud with a single pane of glass for hybrid data governance, end-to-end lineage, and observability.

