Ahorra un 25 % (o incluso más) en tus costes de Kafka | Acepta el reto del ahorro con Kafka de Confluent
Introducing Confluent Platform Preview Releases
Historically, Confluent delivers a new release of Confluent Platform three times per year. While this cadence meets the needs of a meaningful portion of our users, there are some who want faster access to the latest works we are building, and are willing to accept some technical risk to get it. For this special class of user, we now introduce: the preview release.
Preview releases are intermittent, unsupported releases that provide an advance look at upcoming, experimental features. They get you access to unreleased Confluent Platform features and give you the opportunity to shape the platform by sharing your feedback with us. Since preview releases are unsupported, we intend for users to try them in development and testing environments only, and we encourage you to take advantage of Confluent Community resources to get support and share feedback. And remember: the features in preview releases are subject to change in future previews, and may not be available in the next supported release.
With that, we are very excited to introduce our first preview release of Confluent Platform. This first preview release introduces powerful new capabilities for KSQL (streaming SQL for Apache Kafka®) and Confluent Control Center, including a brand new KSQL UI.
Read on to learn all about these new features. And remember to share your feedback and help shape Confluent software! You can do this by visiting the Confluent Community Slack channel (particularly the #ksql and #control-center channels) or by contributing to the KSQL project on GitHub, where you can file issues, submit pull requests, and contribute to discussions.
Confluent Control Center
A UI for KSQL
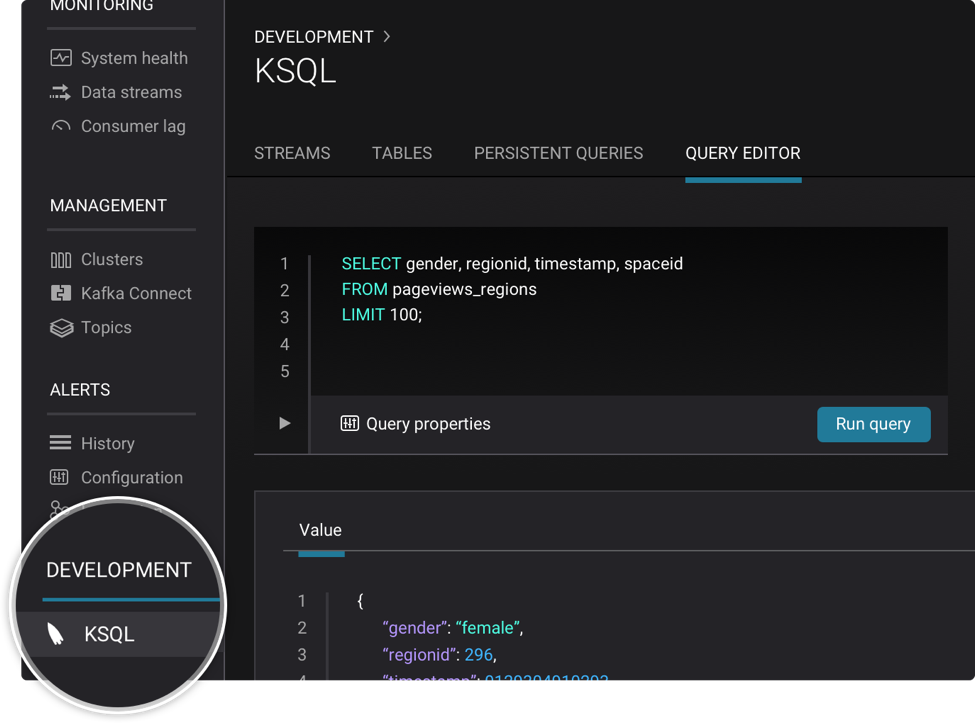
In this preview release, Confluent Control Center provides a graphical UI for KSQL, the streaming SQL engine for Apache Kafka. The experimental KSQL UI in Confluent Control Center has four tabs at the top of the screen, giving you one-click access to view streams, tables, persistent queries, and—hooray!—edit your KSQL queries. You can easily create new streams at the click of a button, and write queries against existing streams and tables through the graphical interface. Having a one-stop interface to view and edit queries is going to prove to be a boon for KSQL development.

Broker Configuration
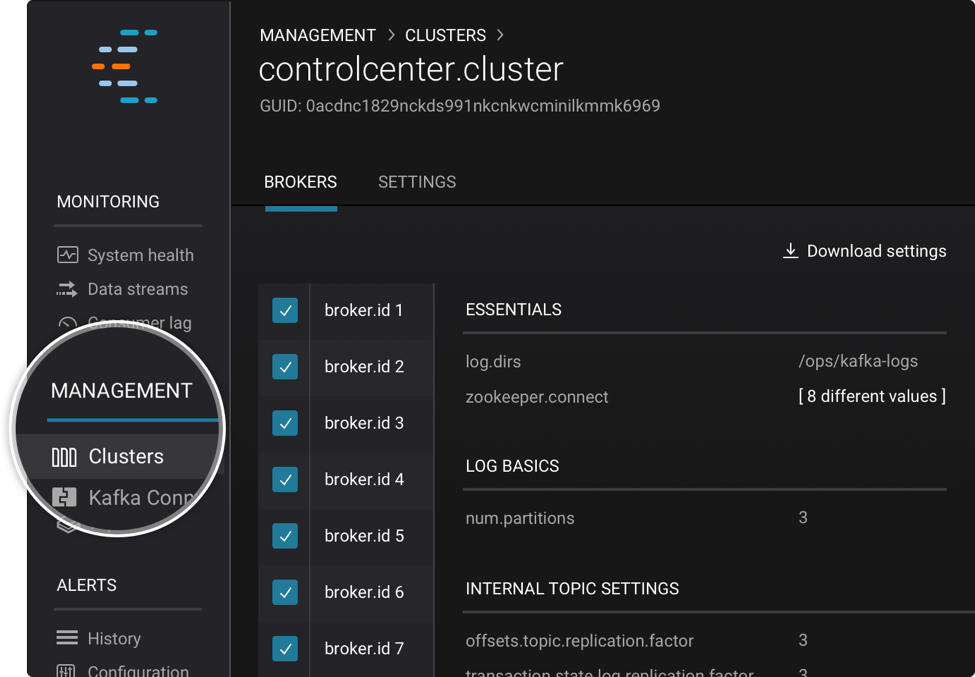
It’s now easier to ensure your brokers are set up correctly. From the Confluent Control Center user interface, you can view broker configurations across multiple Kafka clusters, quickly check specific brokers, and easily spot differences in properties.
To see this in Control Center, click on Clusters in the left-hand navigation bar to get started. Then click the ‘•••’ beside your desired cluster and select ‘Brokers.’ This will take you to a page with a list of brokers on the left and a list of configurations on the right. Each value in gray is identical among all your brokers in this cluster. If you see a label in white (saying, for example, ‘[ 3 different values ]’), clicking on the label will open a drop-down displaying the different configuration values and the brokers they correspond to.
You can also download all of your consolidated broker configurations in JSON format by clicking the ‘Download Configs’ button at the top right.

Topic Inspection
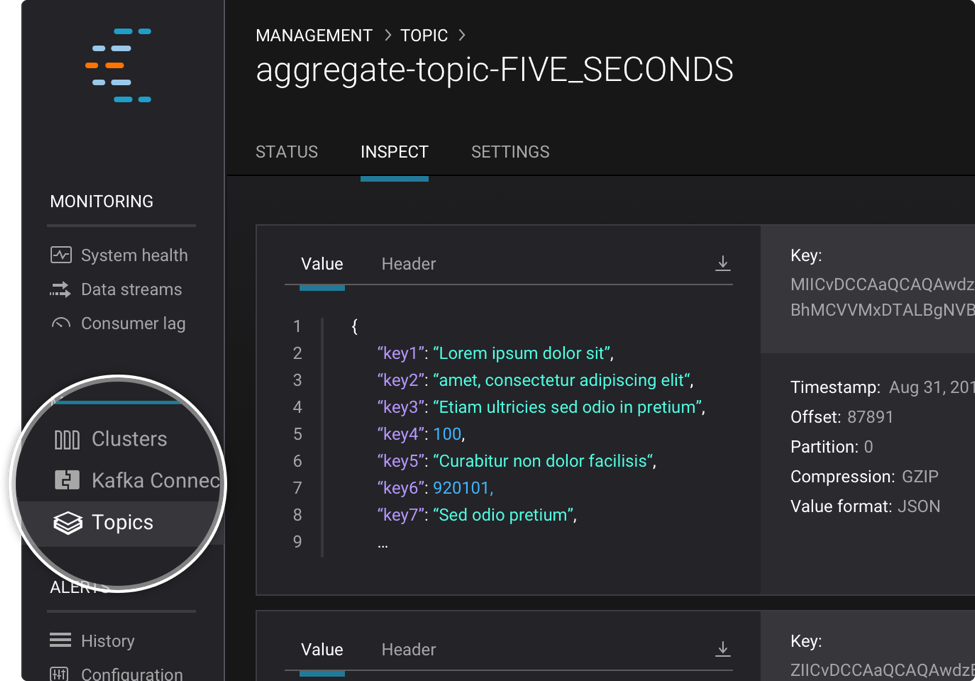
It’s now easy to see the actual streaming messages coming out of Kafka topics using the new topic inspection feature in Control Center.
From Topics in the left-hand navigation bar, click the ‘•••’ beside your desired topic and select ‘View details.’ On your topic’s detail page, you’ll see three tabs at the top: ‘Status’, ‘Inspect’, and ‘Settings.’ If you click the ‘Inspect’, you’ll see messages appear as they are written to your topic. Click the ‘<X> new messages’ button to view the newest messages. Any of us who have built systems on Kafka know how welcome this feature is!

Consumer Lag
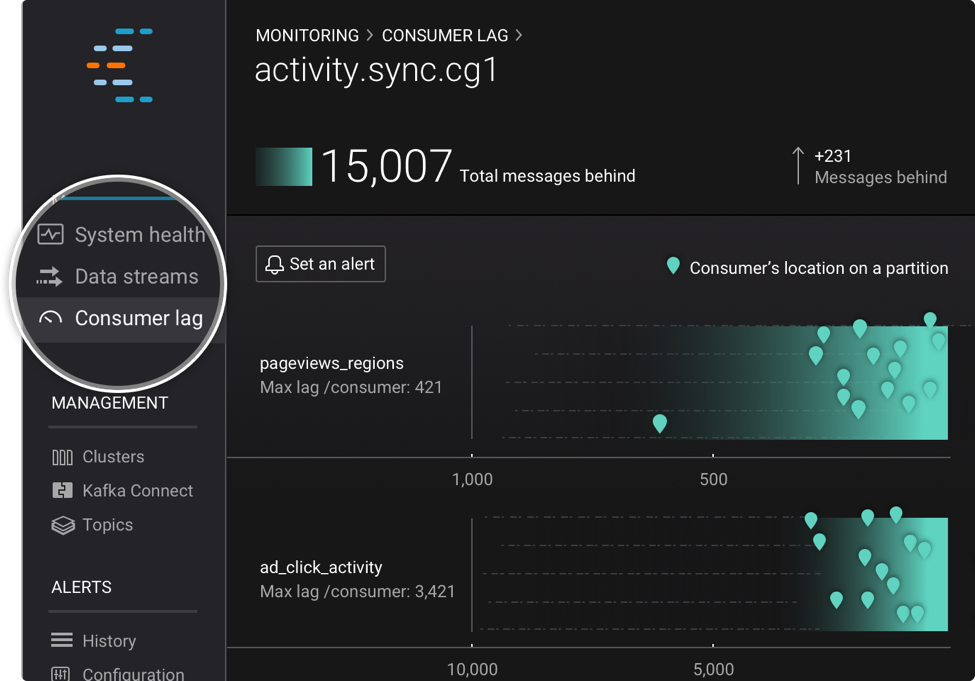
Wondering how your consumers are performing? You can now see if any consumers are behind using the new consumer lag feature. You can also set alerts on consumer lag, so you can monitor performance and proactively address issues whenever you think best.
Click the new Consumer lag option in the left-hand navigation bar to see a list of consumer groups. To see this in Control Center, click the ‘•••’ beside your desired group and select ‘View details.’ You’ll see a racetrack of consumer offsets for each topic that your group consumes from. Each consumer is represented by a green pin, which indicates the position of a given consumer relative to the end of the log. Pins on the right represent consumers closest to the latest offset. Below the charts is a tableview of consumer lag data. You can sort by a variety of fields, including topic name, lag, and offsets, to get a customized view of the data, so you can find out more about how your consumers are performing.

KSQL
An updated KSQL REST API
We’ve made several improvements to the KSQL REST API, including:
- Proper HTTP response status codes returned on error conditions.
- Cleaner hierarchy of response objects with more consistent naming.
- More details about queries in query descriptions returned by EXPLAIN.
You can find the documentation for this API here. Note that this API is backward incompatible with the previous versions, and some aspects of the API may change between this preview and the fully supported release.
We encourage developers to build applications against the API shipped in this preview because it’s closer to the future API, which we plan on keeping stable. We also encourage users to test drive the updated REST API and share their feedback in either the #ksql channel in the Confluent Community Slack or by filing an issue in the KSQL project on GitHub.
More flexible timestamp handling
KSQL now enables you to specify the timestamp format when creating a stream or a table. This allows you to use timestamps in whichever format they occur in your source data, removing the requirement that the timestamp had to be a long representing epoch time. Now you can do this:
KSQL will then interpret the ‘timecol’ correctly based on the format specified and use this value for time-based operations like windowing and joins. You can specify timestamps in any format accepted by the Java DateTimeFormatter.
Aggregations on Tables
KSQL now supports non-windowed usage of the SUM and COUNT aggregation functions on tables. Previously, you could only perform such aggregations on streams.
This unlocks a variety of use cases. For instance, suppose you have a ‘users’ table and want to continuously compute the count of users by postal code. You can now do it as follows:
Added protection when dropping streams and tables
When you execute a `DROP TABLE` or `DROP STREAM` command, KSQL now checks whether there are any currently active queries using that stream or table. If there are, KSQL will prevent you from dropping the stream or table without first terminating the queries which depend on it. This prevents KSQL from getting into an inconsistent internal state and thus boosts stability.
You should now expect to see an error like the one below when you attempt to drop a stream or a table which is in active use:
Where to go from here
Try out the new Confluent Platform 2018.01 preview release and share your feedback! Here’s what you can do to get started:
- Download the Confluent Platform preview release.
- Learn how to use the new features by reading the Confluent Platform 2018.01 preview documentation.
- Run the updated Confluent Platform demo to explore the new capabilities.
- Visit the Confluent Community Slack channel to ask questions or share feedback. To discuss KSQL, visit the #ksql channel. For Confluent Control Center, visit the #control-center channel.
If you are interested in contributing to KSQL, visit the KSQL project on GitHub. Feel free to file issues, submit pull requests, and contribute to discussions.
¿Te ha gustado esta publicación? Compártela ahora
Suscríbete al blog de Confluent
Empowering Customers: The Role of Confluent’s Trust Center
Learn how the Confluent Trust Center helps security and compliance teams accelerate due diligence, simplify audits, and gain confidence through transparency.
Unified Stream Manager: Manage and Monitor Apache Kafka® Across Environments
Unified Stream Manager is now GA! Bridge the gap between Confluent Platform and Confluent Cloud with a single pane of glass for hybrid data governance, end-to-end lineage, and observability.

